Which SaaS Metrics Should You Track? The 5 That Actually Run Your Business
- Written by Chrissy Kapralos
- Published onDec 31, 2025
Table of Contents
Why this question matters more than ever
Every SaaS company tracks metrics.
Most SaaS companies still feel blind.
Dashboards are full. Reports are shared. Meetings happen.
Yet founders, CFOs, and RevOps leaders still ask the same question: Which numbers actually run the business?
This isn’t a tooling problem. It’s a selection problem.
In a software as a service business, metrics are not just measurements. They are control systems. The right SaaS metrics tell you where revenue comes from, how durable it is, and what will break next if nothing changes.
The wrong metrics create noise. Worse, they create confidence without control.
This guide explains how experienced SaaS operators narrow dozens of possible key performance indicators down to five that can be reviewed weekly and tied directly to decisions.
Why most SaaS teams track too many metrics
The dashboard trap: visibility without decisions
Modern analytics tools make it easy to track everything: monthly recurring revenue, annual recurring revenue, churn rate, net revenue retention, customer acquisition cost, average revenue per, monthly active users, customer satisfaction score, and more.
The result is visibility without direction.
Teams look at charts, but don’t change behavior.
Founders sense problems but can’t localize them.
Finance sees revenue growth but can’t explain cash flow risk.
Tracking more SaaS metrics does not automatically improve business health. It often delays action because every signal competes for attention.
What “most important SaaS metrics” really means (context > lists)
Search results are full of “top 10” or “top 20” SaaS metrics lists.
They are not wrong, but they are incomplete.
The most important SaaS metrics depend on:
- Your business model (subscription, usage-based, or hybrid)
- Your go-to-market motion (PLG, sales-led, enterprise)
- Your stage (early, growth, efficiency, mature)
- Your current constraint (growth, retention, cash flow, margin)
A metric is only important if it drives a decision in your current context.
That is the difference between collecting data and running a system.
If you want a faster start, Grow Slash’s AI Metrics Recommendation Engine can suggest an initial “Top 5” based on your model, stage, and motion — but this guide explains the logic so you can validate it.
What you’ll get from this guide (a 5-metric system you can run weekly)
By the end of this guide, you’ll have:
- A clear framework for choosing the right SaaS metrics
- A repeatable five-metric structure used by experienced operators
- Practical templates by stage and go-to-market motion
- A way to review metrics weekly without drowning in data
This is not a benchmark report or a static checklist. It is an operating system for metrics.
SaaS metrics basics (so the framework makes sense)
What SaaS metrics are meant to do inside a SaaS business
SaaS metrics exist to answer three questions:
- How does the company make recurring revenue?
- How durable is that revenue over time?
- What actions will most improve the company’s growth and cash flow?
Metrics are not just retrospective reporting.
They are forward-looking controls for customer acquisition, customer retention, and revenue growth.
If a metric does not change a decision, it is not a key metric.
Leading vs lagging metrics (and why founders confuse them)
Lagging metrics describe outcomes:
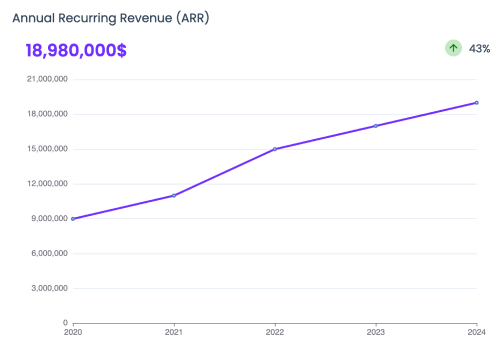
- Monthly recurring revenue (MRR)
- Annual recurring revenue (ARR)
- Total revenue
- Net revenue retention
Leading metrics describe causes:
- Activation rates
- Product usage
- Customer engagement
- Pipeline conversion
Founders often focus too heavily on lagging metrics because they are easier to measure and feel more “real.” But by the time a lagging metric moves, the underlying behavior has already happened.
A good SaaS metrics system pairs outcomes with early signals.
Growth metrics vs retention metrics (don’t mix them without a plan)
Growth metrics answer: How fast is the customer base expanding?
Retention metrics answer: How much value survives over time?
Examples:
- Growth: customers acquired, new customers, marketing efforts, sales process efficiency
- Retention: customer churn, revenue churn, gross revenue retention, net dollar retention
Mixing these without clarity hides problems.
A SaaS business can grow MRR while bleeding customers.
It can also retain well while failing to acquire customers efficiently.
You need both, but you need to know which problem you are solving now.
A simple rule: every metric must tie to a decision
Before adding any metric, ask:
- What decision will this number change?
- Who owns that decision?
- How often can we act on it?
If you can’t answer those three questions, the metric does not belong in your Top 5.
At this point, the goal is not to collect more metrics — it’s to design a small, repeatable system for choosing the right ones.
The framework below is a simple, operator-tested process for defining your Top 5 SaaS metrics. Each step narrows the universe of possible metrics until only the ones that actually run your business remain.
Step 1 — Start with your business model and recurring revenue
Software as a service revenue mechanics (why recurring revenue is different)
In SaaS, revenue compounds.
Customer lifetime matters more than one-time sales.
Recurring revenue means:
- Today’s sales affect future months
- Churn creates long-term drag
- Expansion revenue can outperform acquisition
That is why SaaS metrics focus on flows, not snapshots.
Subscription revenue vs usage-based vs hybrid (what changes in measurement)
Subscription revenue
- Predictable monthly subscription revenue
- Churn and retention are primary risks
- MRR and ARR are strong operating metrics
Usage-based revenue
- Revenue tied to customer activity
- Expansion and contraction matter more than logo churn
- Revenue churn rate becomes critical
Hybrid models
- Combine both dynamics
- Require clearer definitions to avoid reporting noise
Your business model determines which SaaS metrics are meaningful.
Monthly recurring revenue (MRR) vs annual recurring revenue (ARR)
MRR and ARR describe the same recurring revenue stream at different time scales.
- MRR = normalized monthly subscription revenue
- ARR = MRR × 12 (with adjustments for annual contracts)
Both are important, but they serve different purposes.
You can find formal definitions and calculation guidance in the Grow Slash Metrics Hub, which acts as a shared reference point for SaaS metrics definitions: https://www.growslash.com/metrics
When MRR is the better operating metric
MRR is better when:
- You operate monthly
- Pricing changes frequently
- You want fast feedback loops
- You are early-stage or growth-stage
MRR moves quickly and reflects customer behavior faster.
For a deeper breakdown, see the optional reference on Monthly Recurring Revenue (MRR): https://www.growslash.com/metrics/monthly-recurring-revenue-mrr
When ARR is the better planning metric
ARR is better when:
- You sell annual contracts
- You plan headcount and budgets
- You report to investors or a board
- You operate enterprise or high ACV motions
ARR smooths volatility and supports long-term planning.
Total revenue vs recurring revenue (why this creates reporting noise)
Total revenue includes:
- One-time fees
- Professional services
- Usage spikes
- Non-recurring items
Recurring revenue reflects the business model’s health.
Mixing them hides churn, distorts growth metrics, and weakens forecasting. For SaaS companies, recurring revenue should be the primary lens.
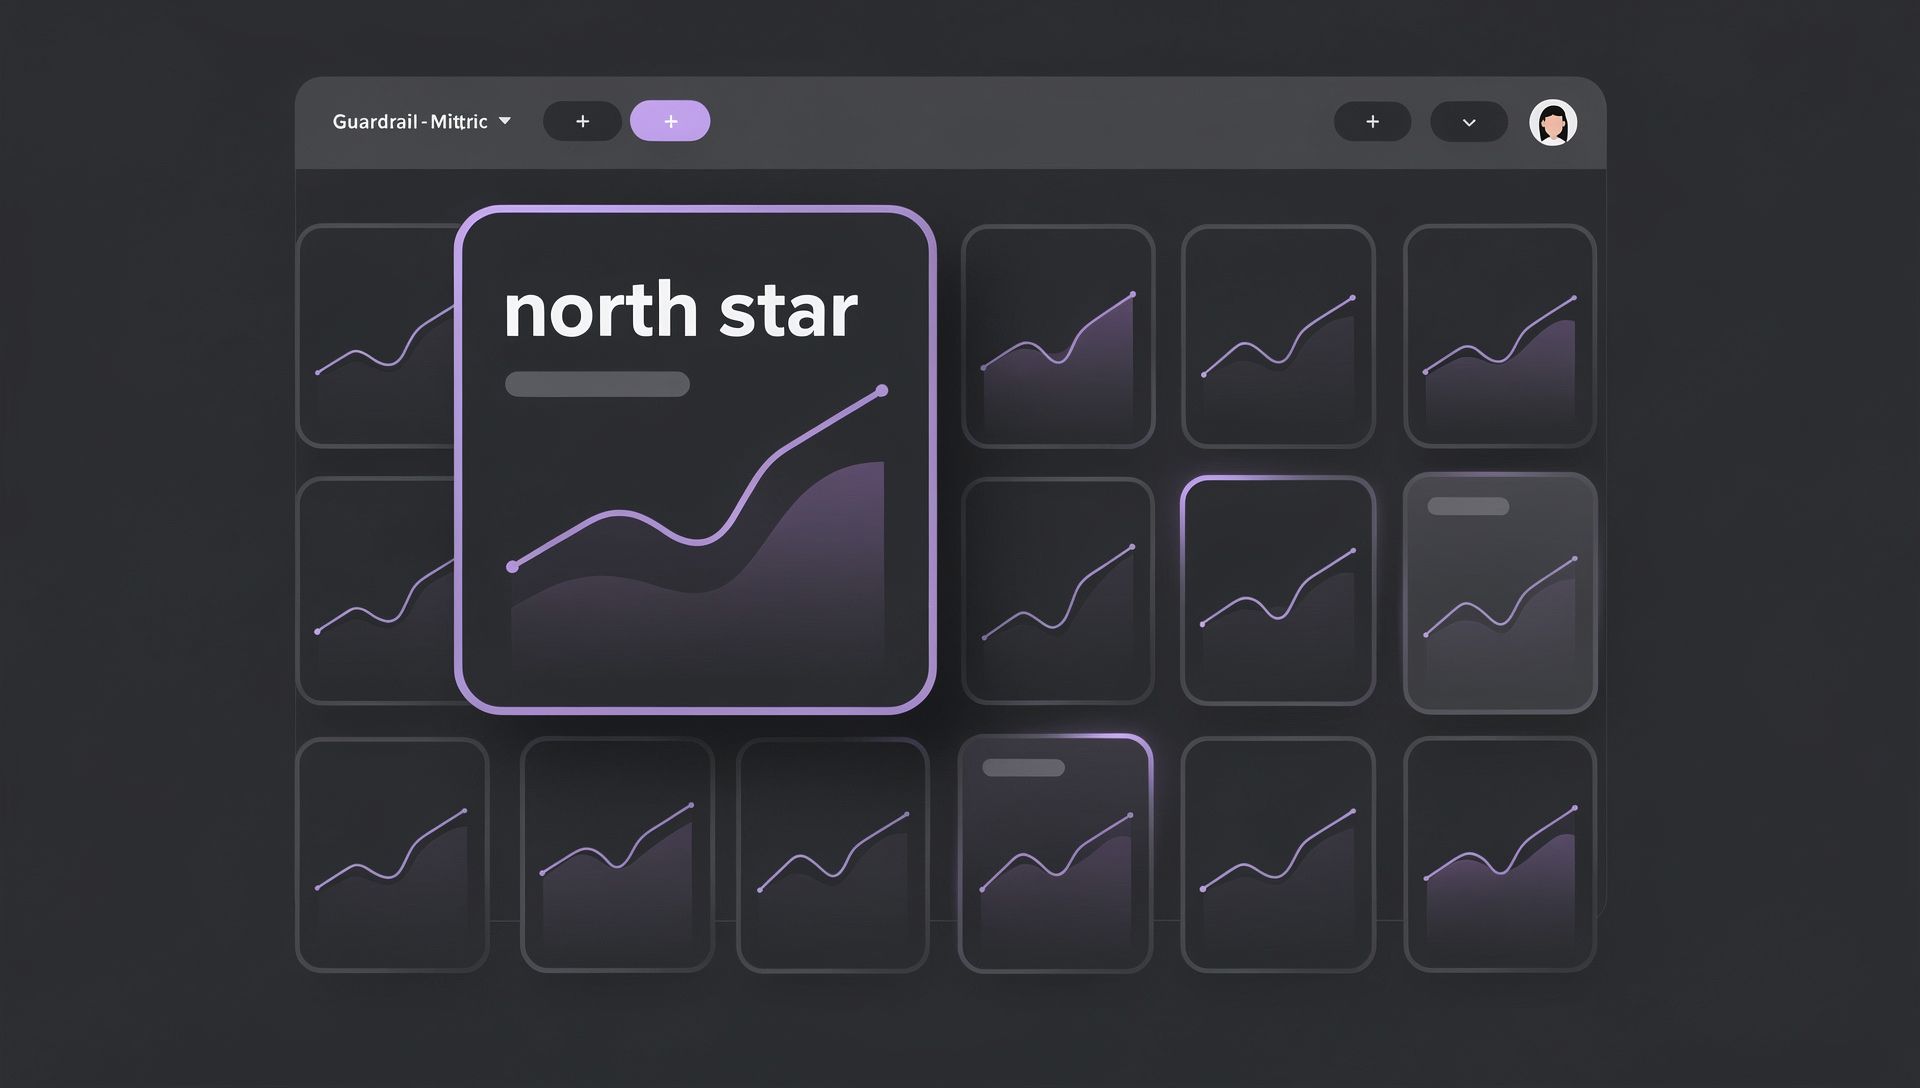
Step 2 — Pick the “primary signal” metric (your North Star)
What a north star metric is (and what it is not)
A north star metric is:
- A single primary signal of company progress
- Closely tied to customer value
- Influencable by teams weekly
It is not:
- A vanity metric
- A static KPI forever
- A substitute for financial metrics
The north star aligns teams, but it does not replace financial discipline.
North Star examples by go-to-market motion
PLG / self-serve SaaS companies
Common north stars:
- Weekly active teams
- Activated paying customers
- Product-qualified accounts
These emphasize customer engagement and activation.
Sales-led SaaS companies
Common north stars:
- New ARR booked
- Qualified pipeline value
- Closed-won revenue
These align with the sales process and forecasting.
Enterprise + annual contract value (ACV) motion
Common north stars:
- Net dollar retention
- Expansion revenue per account
- Average contract value growth
Durability and expansion matter more than volume.
Usage-based software companies
Common north stars:
- Active usage volume
- Revenue per active customer
- Expansion-driven ARR growth
Usage is the leading indicator.
The common mistake: picking a metric you can’t influence weekly
If your north star only changes monthly or quarterly, teams disengage.
A good north star should:
- Move frequently enough to matter
- Be influenced by product, sales, or customer success actions
- Reflect real customer value
Step 3 — The 5-metric framework founders use (the exact structure)
The Top 5 shape (always the same)
Regardless of stage or model, the structure stays consistent.
- Growth/output metric
- Retention/quality metric
- Acquisition efficiency metric
- Activation/conversion metric
- Leading indicator metric
The definitions change. The shape does not.
1) Growth/output metric (the result)
This shows whether the company’s revenue engine is producing results.
Examples:
- Monthly recurring revenue MRR
- Annual recurring revenue ARR
- Net new recurring revenue
2) Retention/quality metric (durability)
This shows how much value survives over time.
Examples:
- Customer churn rate
- Revenue churn rate
- Net revenue retention
3) Acquisition efficiency metric (cost to grow)
This shows how expensive growth is.
Examples:
- Customer acquisition cost CAC
- CAC payback period
- Marketing expenses as a share of revenue
4) Activation/conversion metric (how new customers reach value)
This shows whether customers actually realize value.
Examples:
- Activation rate
- Trial-to-paid conversion
- Time to first value
5) Leading indicator metric (what changes first)
This moves before revenue does.
Examples:
- Customer engagement
- Product usage frequency
- Customer feedback signals
How to keep metrics actionable
One definition per metric (prevents drift)
Ambiguous definitions cause reporting conflicts.
Every metric should have a single source of truth.
One owner per metric (accountability)
Each metric needs an owner who explains changes and proposes actions.
One weekly review cadence (30 minutes)
Weekly reviews keep metrics operational, not ceremonial.
The core SaaS metrics inside the framework (what they measure)
Recurring revenue: MRR and ARR (and subscription revenue basics)
Recurring revenue reflects predictable income from paying customers.
MRR and ARR normalize pricing differences and contract lengths so trends are visible.
Monthly subscription revenue vs MRR (when they differ)
Monthly subscription revenue is raw billing.
MRR normalizes annual contracts and discounts.
They differ when:
- Annual contracts are prepaid
- Discounts are applied
- Mid-cycle upgrades occur
MRR is the better operating metric.
Retention: customer churn rate, customer retention rate, and retention metrics
Retention metrics show how many customers or how much revenue you keep.
- Customer churn rate: customers lost ÷ customers at start
- Customer retention rate: inverse of churn
- Retention metrics: umbrella term covering churn, retention, and expansion
Customer churn vs revenue churn vs revenue churn rate
- Customer churn counts logos lost
- Revenue churn measures revenue lost from existing customers
- Revenue churn rate normalizes revenue churn over time
High-value customers make revenue churn more important than logo churn.
Gross revenue retention (GRR) vs net revenue retention (NRR / net dollar retention)
- GRR excludes expansion revenue
- NRR includes expansion revenue
GRR shows product stickiness.
NRR shows account expansion and pricing power.
Net dollar retention vs NRR (same idea, different naming)
Net dollar retention and net revenue retention describe the same metric.
Consistency matters more than naming.
Expansion revenue and why it changes the story
Expansion revenue comes from:
- Upsells
- Cross-sells
- Usage growth
Strong expansion can offset churn and drive SaaS growth with lower acquisition costs.
Acquisition: customer acquisition cost (CAC) and customer acquisition strategy
CAC measures the cost to acquire customers.
It includes:
- Marketing expenses
- Sales compensation
- Tools and overhead related to acquisition
Customer acquisition strategy determines whether CAC is sustainable.
What to include in CAC (marketing expenses + sales process)
Include:
- Paid marketing
- Sales salaries and commissions
- Marketing tools
- Attribution-related costs
Exclude:
- R&D
- Customer success
- General overhead
CAC payback period (why it matters more than CAC alone)
CAC payback shows how long it takes to recover acquisition costs.
Shorter payback improves cash flow and reduces financing risk.
Value: customer lifetime value (CLV / LTV) and customer lifetime
Customer lifetime value reflects average revenue per customer multiplied by average customer lifespan.
It answers: How much is one customer worth over their lifetime?
Average customer lifespan and what it implies
Longer lifespans:
- Increase lifetime value
- Improve gross margin leverage
- Reduce pressure on marketing efforts
Short lifespans signal retention problems.
LTV:CAC sanity checks (avoid false confidence)
LTV:CAC ratios only matter if:
- LTV assumptions are realistic
- Churn is stable
- Expansion revenue is sustainable
Inflated LTV hides problems.
Satisfaction: customer satisfaction and customer feedback
Satisfaction metrics capture sentiment, not behavior.
They are complements, not replacements, for retention metrics.
Net promoter score (NPS) vs customer satisfaction score
- Net promoter score NPS measures advocacy
- Customer satisfaction score measures immediate sentiment
Both are useful, but neither predicts revenue alone.
How NPS relates to customer success (without replacing retention)
Customer success teams use NPS and feedback to:
- Identify at-risk accounts
- Prioritize outreach
- Improve onboarding
Retention metrics confirm whether success efforts work.
Copy-paste templates: the best 5 metrics by stage
Early-stage (pre-seed / seed): find signal fast
Focus on learning, not optimization.
Suggested Top 5 set
- Weekly active users or activated accounts
- New customers
- Customer churn rate
- CAC (simple version)
- Customer feedback volume
Growth stage: scale without breaking retention
Focus on sustainable revenue growth.
Suggested Top 5 set
- Monthly recurring revenue MRR
- Net revenue retention
- Customer acquisition cost CAC
- Activation rate
- Customer engagement metric
Efficiency stage: improve payback and gross margin
Focus on cash flow discipline.
Suggested Top 5 set
- Net new ARR
- Gross revenue retention
- CAC payback period
- Gross margin
- Revenue churn rate
Mature SaaS companies: optimize profitability and positive cash flow
Focus on durability and returns.
Suggested Top 5 set
- Net dollar retention
- Free cash flow margin
- Expansion revenue
- Customer lifetime value LTV
- Customer turnover by segment
Optimize Your MRR Calculation
- Clarity on New, Expansion, Contraction, Churn, and Reactivation MRR
- Drive informed decisions with detailed revenue insights
- Customize metrics to fit your subscription business needs
Copy-paste templates: the best 5 metrics by motion
Product-led growth (PLG): usage, activation, and conversion
Suggested Top 5 set
- Activated paying customers
- Product activation rate
- Customer churn
- CAC (blended)
- Weekly product usage
Sales-led: pipeline discipline + retention durability
Suggested Top 5 set
- New ARR booked
- Net revenue retention
- CAC payback
- Win rate
- Pipeline coverage ratio
Enterprise / ACV: cohort stability + expansion depth
Suggested Top 5 set
- Net dollar retention
- Expansion ARR
- Gross revenue retention
- Average contract value ACV
- Renewal rate
Hybrid motions (what changes when you add sales to PLG)
Hybrid models require:
- Separate funnels
- Clear attribution
- Segment-level metrics
Avoid blended averages.
Benchmarking: how to tell if your numbers are good
Why benchmarking data is misleading without segmentation
Benchmarks hide variability.
A “good” churn rate depends on:
- Customer size
- Industry
- Contract length
- Business model
Unsegmented benchmarks mislead decisions.
What to benchmark first (NRR, churn rate, CAC payback, gross margin)
Start with:
- Net revenue retention
- Customer churn rate
- CAC payback period
- Gross margin
These reflect business health, not surface growth.
How to benchmark by company size, customer segment, and business model
Always segment by:
- Revenue band
- Customer profile
- Contract type
Context turns benchmarks into insight.
When benchmarks help vs when they distract
Benchmarks help when:
- Setting expectations
- Identifying outliers
They distract when:
- Used as targets without context
- Replacing internal trends
Mistakes that make SaaS reporting unreliable
Measuring existing customers incorrectly (cohorts, pauses, downgrades)
Ignoring cohorts hides churn patterns.
Pauses and downgrades distort retention metrics.
Mixing total revenue with recurring revenue (false growth)
One-time revenue inflates growth and masks churn.
Hiding customers acquired and customers lost inside net numbers
Net growth hides underlying motion.
Track customers acquired and customers lost separately.
Treating “important SaaS metrics” like a checklist instead of a system
Metrics work together.
Isolated metrics mislead.
Ignoring customer engagement signals until churn shows up
By the time churn appears, it is too late.
How Grow Slash helps you choose and standardize the right SaaS metrics
AI Metrics Recommendation Engine (3-step flow)
Grow Slash offers an AI-driven starting point for metric selection, designed for SaaS operators who want structure without guesswork.
- Fill the form
Provide your business model, stage, and motion. - AI engine analyzes and benchmarks your SaaS business
The system maps your context to relevant key SaaS metrics. - Get a tailored list of critical metrics
You receive a prioritized Top 5 with rationale and definitions.
You can explore the engine here:
https://www.growslash.com/ai-metrics-recommendation
FAQ
What metrics should I track for SaaS if I’m early-stage?
Track learning metrics: activation, engagement, customer feedback, and simple churn signals. Avoid over-optimizing financial ratios too early.
What are the most important SaaS metrics for founders vs CFOs?
Founders focus on growth and activation. CFOs focus on retention, CAC payback, and cash flow. Both need shared definitions.
How do I calculate monthly recurring revenue (MRR) correctly?
Normalize subscription revenue to a monthly basis, excluding one-time fees. Consistency matters more than precision.
What’s a healthy customer churn rate for SaaS companies?
It depends on stage, segment, and contract length. Segment first, then benchmark.
How often should I review metrics (weekly vs monthly)?
Operational metrics weekly. Financial summaries monthly.
Can my north star metric change over time?
Yes. It should evolve as your business model and constraints change.
Conclusion: the simplest next steps
Pick your context (model + motion + stage).
Choose your north star metric.
Commit to your Top 5 and review them weekly.
If you want a structured starting point, you can generate a tailored Top 5 using Grow Slash’s AI Metrics Recommendation Engine:
https://www.growslash.com/ai-metrics-recommendation
Get Started with
Grow Slash
Join over 1,452+ startups already growing with our insights
Read more Blogs
Elevate your strategies with our expert advice and tips!


Jan 11, 2025
Dashboards and Visualization
Get started with Growslash